ASP.NET 5 and Log Correlation by Request Id
Related Posts
ASP.NET 5 is full of big new features and enhancements like being able to run on multiple operating systems, incredible CLI tools, hassle-free building for multiple framework targets, build only dependencies and many more. Besides these, I am mostly impressed by little, tiny features of ASP.NET 5 because these generally tend to be ignored in this type of rearchitecturing works. One of these little features is log correlation. Let me quickly show you what it is and why it made me smile.
BIG ASS CAUTION! At the time of this writing, I am using DNX 1.0.0-beta8 version. As things are moving really fast in this new world, it’s very likely that the things explained here will have been changed as you read this post. So, be aware of this and try to explore the things that are changed to figure out what are the corresponding new things.
Also, inside this post I am referencing a lot of things from ASP.NET GitHub repositories. In order to be sure that the links won’t break in the future, I’m actually referring them by getting permanent links to the files on GitHub. So, these links are actually referring the files from the latest commit at the time of this writing and they have a potential to be changed, too. Read the "Getting permanent links to files" post to figure what this actually is.
Brief Introduction to Logging in ASP.NET 5 World
If you want to skip this part, you can directly go to "Log Correlation" section below.
As you probably know, ASP.NET 5 also has a great support for logging. The nicest thing about this new logging abstraction is that it’s the only logging abstraction which every provided library and framework is relying on. So, when you enable logging in your application, you will enable it in all components (which is perfect)! Here is a sample in my MVC 6 application. I am just adding MVC to pipeline here, enabling logging by hooking Serilog and configuring it to write the logs to console:
using System;
using Microsoft.AspNet.Builder;
using Microsoft.Framework.DependencyInjection;
using Microsoft.Framework.Logging;
using Serilog;

namespace LoggingCorrelationSample
{
    public class Startup
    {
        public Startup(ILoggerFactory loggerFactory)
        {
            var serilogLogger = new LoggerConfiguration()
                .WriteTo
                .TextWriter(Console.Out)
                .MinimumLevel.Verbose()
                .CreateLogger();

            loggerFactory.MinimumLevel = LogLevel.Debug;
            loggerFactory.AddSerilog(serilogLogger);
        }

        public void ConfigureServices(IServiceCollection services)
        {
            services.AddMvc();
        }

        public void Configure(IApplicationBuilder app)
        {
            app.UseMvc();
        }
    }
}
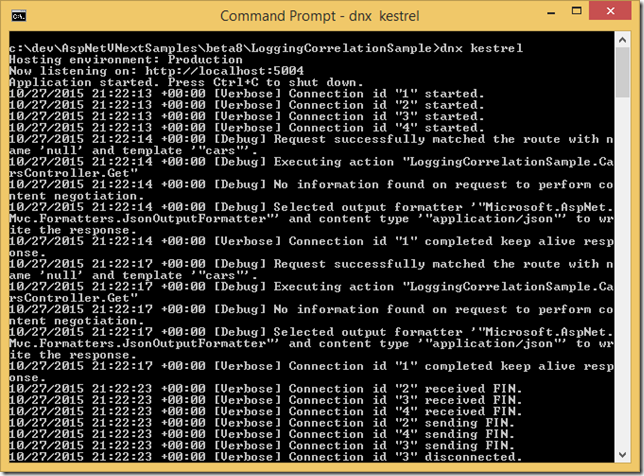
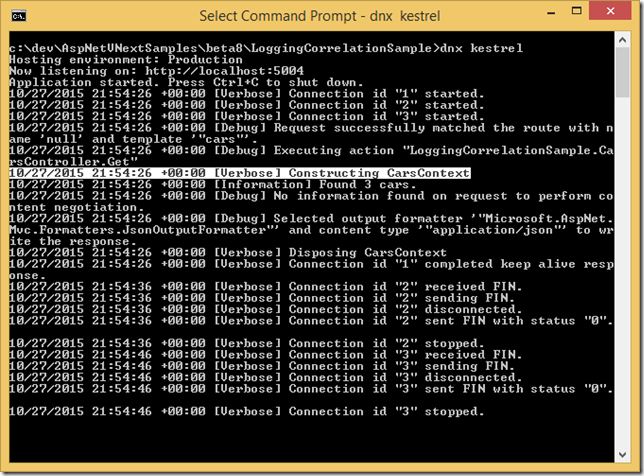
When I run the application and hit a valid endpoint, I will see bunch of things being logged to console:
Remember, I haven’t logged anything myself yet. It’s just the stuff I hooked in which were already relying on ASP.NET 5 logging infrastructure. This doesn’t mean I can’t though. Hooking into logging is super easy since an instance of ILoggerFactory is already inside the DI system. Here is an example class which I have for my application and it is responsible for getting the cars (forgive the stupid example here but I am sure you will get the idea):
public class CarsContext : IDisposable
{
    private readonly ILogger _logger;

    public CarsContext(ILoggerFactory loggerFactory)
    {
        _logger = loggerFactory.CreateLogger<CarsContext>();
        _logger.LogDebug("Constructing CarsContext");
    }

    public IEnumerable<string> GetCars()
    {
        _logger.LogInformation("Found 3 cars.");

        return new[]
        {
            "Car 1",
            "Car 2",
            "Car 3"
        };
    }

    public void Dispose()
    {
        _logger.LogDebug("Disposing CarsContext");
    }
}
I will register this class so that it can get the dependencies it needs and also, it can be injected into other places:
public void ConfigureServices(IServiceCollection services)
{
    services.AddMvc();
    services.AddScoped<CarsContext, CarsContext>();
}
Finally, I will use it inside my controller:
public class CarsController : Controller
{
    private readonly CarsContext _carsContext;

    public CarsController(CarsContext carsContext)
    {
        _carsContext = carsContext;
    }

    [Route("cars")]
    public IActionResult Get()
    {
        var cars = _carsContext.GetCars();
        return Ok(cars);
    }
}
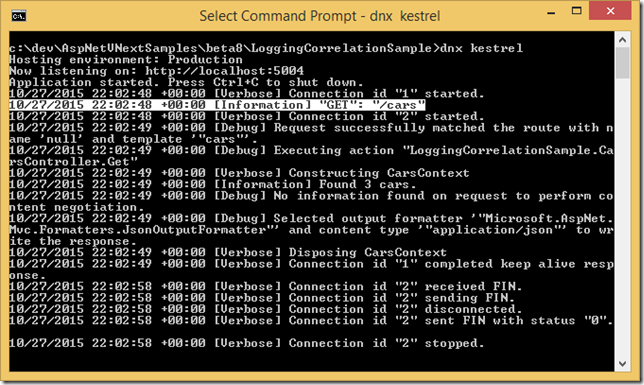
Just seeing how beautifully things are coming together is really great! When I run the application and hit the /cars endpoint now, I will see my logs appearing along side the framework and library logs:
Same goes for your middlewares. You can naturally hook into logging system from your middleware thanks to first class middleware DI support.
public class RequestUrlLoggerMiddleware
{
    private readonly RequestDelegate _next;
    private readonly Microsoft.Framework.Logging.ILogger _logger;

    public RequestUrlLoggerMiddleware(RequestDelegate next, ILoggerFactory loggerFactory)
    {
        _next = next;
        _logger = loggerFactory.CreateLogger<RequestUrlLoggerMiddleware>();
    }

    public Task Invoke (HttpContext context)
    {
        _logger.LogInformation("{Method}: {Url}", context.Request.Method, context.Request.Path);
        return _next(context);
    }
}
Notice that we have a log message template rather the actual log message here. This is another great feature of the new logging system which is pretty much the same as what Serilog have had for log time.
When we run this, we should see the middleware log appear, too:
Log Correlation
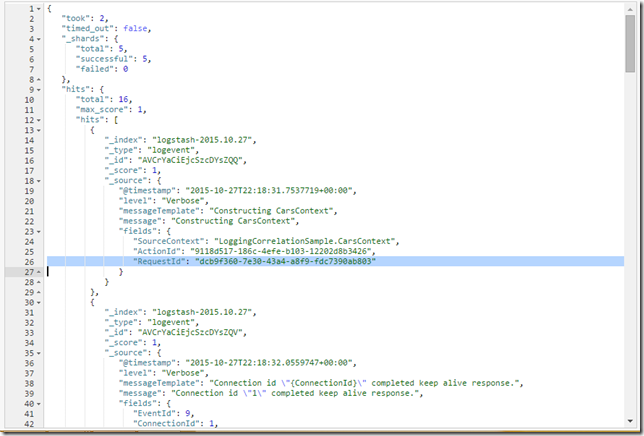
Without doing anything else first, let me also write logs to Elasticsearch by pulling in Serilog Elasticsearch sink and hooking it in. After hitting the same endpoint, I have the below result inside my Elasticsearch index:
You can see that each log message has got richer and we can see new things like RequestId which will allow you to correlate your logs per request. This information is being logged because the hosting layer starts a new log scope for each request. RequestId is particularly useful when you have an unexpected behavior with an HTTP request and you want to see what was happening with that request. In order to take advantage this, you should send the the RequestId along side your response (ideally among the response headers). The below is a sample middleware which you can hook into your pipeline in order to add RequestId to your response:
public class RequestIdMiddleware
{
    private readonly RequestDelegate _next;

    public RequestIdMiddleware(RequestDelegate next)
    {
        _next = next;
    }

    public async Task Invoke(HttpContext context)
    {
        var requestIdFeature = context.Features.Get<IHttpRequestIdentifierFeature>();
        if (requestIdFeature?.TraceIdentifier != null)
        {
            context.Response.Headers["RequestId"] = requestIdFeature.TraceIdentifier;
        }

        await _next(context);
    }
}
Note that, IHttpRequestIdentifierFeature is the way to get a hold of RequestId in beta8 but in upcoming versions, it’s likely to change to HttpContext.TraceIdentifier.
If you look at the response headers now, you should see the RequestId header there:
HTTP/1.1 200 OK
Date: Wed, 28 Oct 2015 00:32:22 GMT
Content-Type: application/json; charset=utf-8
Server: Kestrel
RequestId: 0b66784c-eb98-4a53-9247-8563fad85857
Transfer-Encoding: chunked
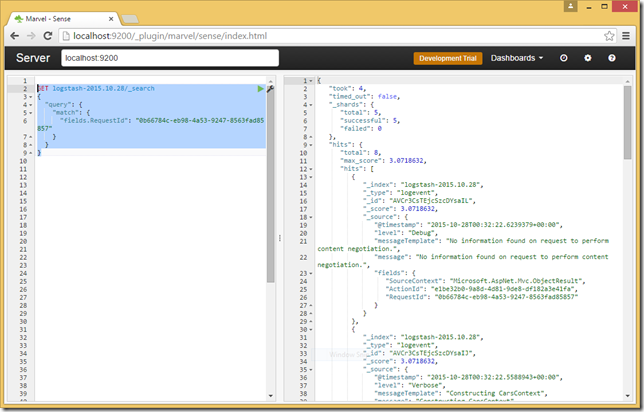
Assuming that I have problems with this request and I have been handed the RequestId, I should be able to see what happened in that request by running a simple query on my Elasticsearch index:
That’s pretty much it and as mentioned, this is one those tiny features which was always possible but painful to get it all right. If you are also interested, you can find the full source code of the sample under my GitHub repository.
